The Solution for GRE Biology Practice Test [160-179]
추천글 : 【GRE】 Solution for GRE Biology Practice Test
Questions 160-162 refer to the following experiment.
The graph below shows the metabolic rate of a small fish over a wide range of water temperatures while the fish is swimming at maximal sustainable speed (curve A) and while at rest (curve B).
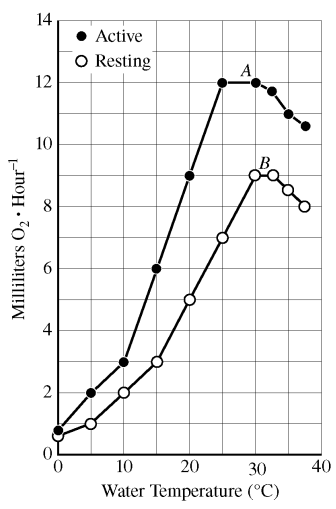
160. At which of the following water temperatures is the resting metabolism of the fish maximal?

⑴ answer: D
161. Endurance is often related to the amount by which metabolic rate can be elevated. On the basis of this assumption, at what temperature would the fish be expected to have the greatest endurance?

⑴ answer: C
⑵ endurance = k × (yActive - yResting), k > 0
162. The Q10 for resting metabolism between 10 ℃ and 20 ℃ is

⑴ answer: C
⑵ The Q10 temperature coefficient is a measure of temperature sensitivity based on the chemical reactions.

⑶ Q10 for recting metabolism between 10 ℃ and 20 ℃ = 2.5
⑷ Q10 for active metabolism betweeb 10 ℃ and 20 ℃ = 3
⑸ Q10 for resting metabolism between 30 ℃ and 35 ℃ = 1
Questions 163-166
Biologists performed an experiment with flies to examine the effects of population size on the maintenance of genetic variation and on egg-to-adult survival. From a large source population, they randomly assigned eggs to three experimental populations of size N, equal to 20 60, and 100. For later generations, they collected N eggs from each that emerged and used tissue samples from the adults for genetic analyses. Genetic variation was measured by scoring alleles at several polymorphic loci and expressed as the average number of alleles at those loci. The results are summarized in Figure 1 and Figure 2 below.
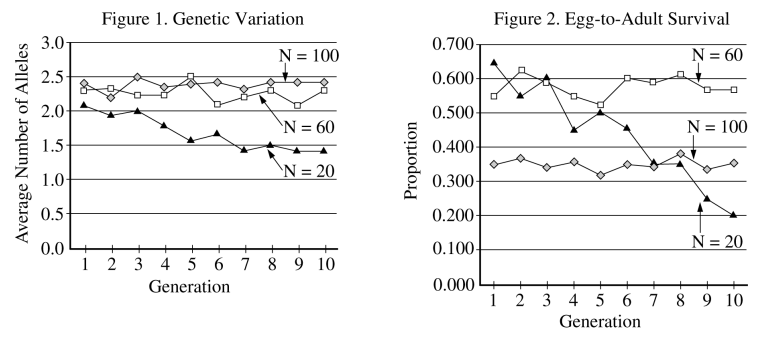
163. Based on Figure 1, which of the following best describes the change in genetic variation over time?

⑴ answer: D
164. Which process best explains the dynamics of genetic variation observed in this experiment?
⑴ answer: A
⑵ Genetic drift is a main source of small evolution.
165. The numbers of adult flies that emerged from the three population in the first generation are closest to which of the following?

⑴ answer: A
⑵ N = 100 → 100 × 0.35 = 35
⑶ N = 60 → 60 × 0.55 = 33
⑷ N = 20 → 20 × 0.65 = 13
166. Which other process appears to have substantially influenced the outcome of this experiment?

⑴ answer: A
Questions 167-170
Two action potentials are portrayed in the figure below. The solid line is an intracellular recording from a motor neuron (neuron A) in the spinal cord of a frog. The broken line is a recording from a sensory neuron (neuron B) in the same animal.

167. At time = 0, relative to neuron A, neuron B is

⑴ answer: C
⑵ A : -70 mV (resting)
⑶ B : -100 mV (resting)
168. At time = 0, which of the following exerts the predominant influence on the membrane potential?

⑴ answer: D
⑵ selective permeability of cell membranes (Na+ < K+) : Some K+ channels are open, making an equilibrium potential.
169. The change in polarization of neuron B between time = 0 and time = 1 is due to which of the following?

⑴ answer: C
⑵ generation of action potential
170. Which of the following best describes the ionic currents at the peak (see arrow) of the action potential for neuron B?
⑴ answer: B
⑵ At the arrow, the rate of change in the potential difference is zero.
Questions 171-173
Cardiac output (CO), the volume of blood pumped per minute by the heart, is the product of stroke volume (SV) and heart rate (HR); that is, CO = SV × HR.
Heart rate can be measured directly, and cardiac output is obtained by the Fick method using the equation CO = Q' / (A - V), where Q' = the oxygen consumed (mL·min-1) and A - V = the difference in oxygen content between arterial blood and venous blood. Given values for HR and CO, stroke volume is subsequently calculated.
The following data were collected before and during vigorous human exercise.

171. Based on the data, during exercise cardiac output increased by a factor of approximately

⑴ answer: B
⑵ at rest : CO = 250 / 50 = 5
⑶ during exercise : CO = 1500 / 150 = 10
172. Based on the data, which of the following best describe how stroke volume changes during exercise?

⑴ answer: E
⑵ at rest : SV = CO / HR = 1/12
⑶ during exercise : SV = CO / HR = 1/12
173. Based on the data, it can be concluded that increased cardiac output during exercise is primarily a function of an increase in which of the following?

⑴ answer: A
⑵ CO = HR × SV
⑶ SV is unchanged.
Questions 174-176
The figure below represents a temporal plot of recorded breeding activities of both allopatric and sympatric populations of three related species of Rana (leopard frog). Rana males attract females by vocalizing. The key quantifies numbers of observed breeding records for each population.

174. Which of the following is correct on the data?

⑴ answer: C
175. Based on the data, which of the following inferences is most likely correct?
⑴ answer: B
176. The data suggest that when the three Rana species occur sympatrically they exhibit which of the following?

⑴ answer: A
⑵ prezygotic reproductive isolation : fertilization failure
⑶ postzygotic reproductive isolation : Fertilization can be made, but hybrids cannot reproduce.
Questions 177-179

The graph above represents the relationship among serum concentrations of human immunodeficiency virus (HIV) RNA, anti-HIV antibody, and CD4+ and CD8+ T cells over a 10-year period following infection of an individual by the virus, with resulting disease.
177. What is the primary explanation for the drop in HIV concentration during the 6- to 12-week period following infection?

⑴ answer: B
178. Based on the data, during which time period is an individual infectious?

⑴ answer: E
179. Which of the following is the best explanation for the gradual rise in HIV concentration after year 1 of infection?

⑴ answer: B
입력: 2023.05.29 22:53
'▶ 자연과학' 카테고리의 다른 글
| 【GR0627】 The Solution for GRE Chemistry Practice Test [01-20] (0) | 2023.06.04 |
|---|---|
| 【GR1724】 The Solution for GRE Biology Practice Test [180-194] (0) | 2023.05.30 |
| 【GR1724】 The Solution for GRE Biology Practice Test [141-159] (0) | 2023.05.21 |
| 【GR1724】 The Solution for GRE Biology Practice Test [120-140] (0) | 2023.05.21 |
| 【GR1724】 The Solution for GRE Biology Practice Test [101-119] (0) | 2023.05.19 |


최근댓글